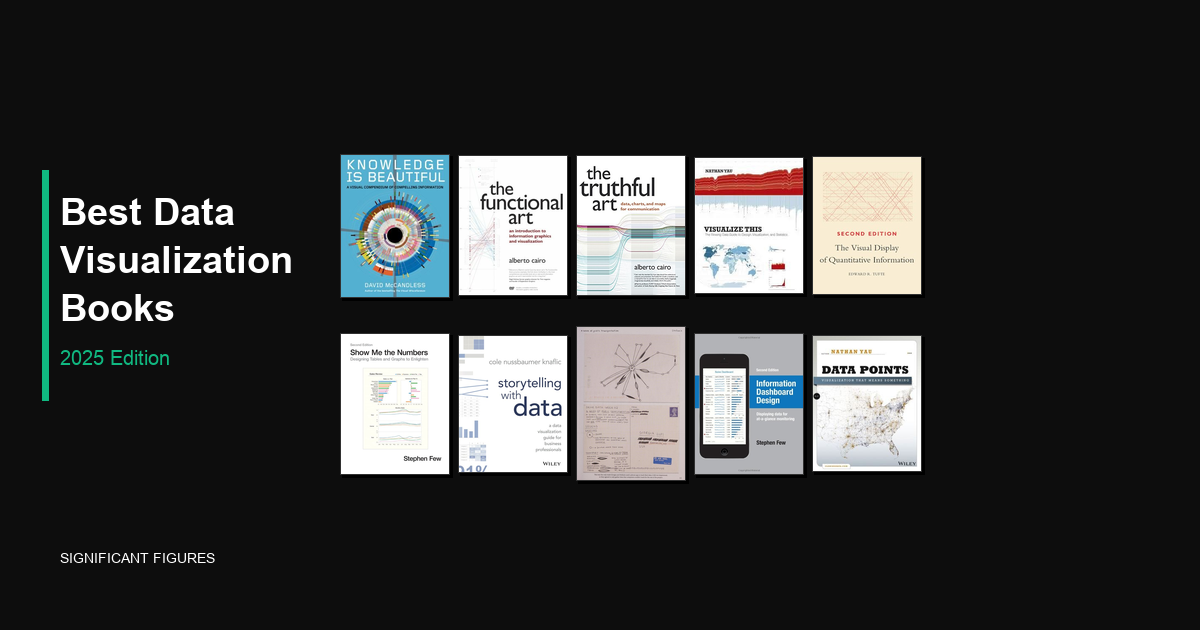
The 10 Best Data Visualization Books in 2025
The 10 Best Data Visualization Books in 2025
The essential reads for anyone who wants to communicate data effectively.
1. The Visual Display of Quantitative Information — Edward R. Tufte
⭐ 4.4/5 (68 ratings) · 197 pages · First published 1983
INTERMEDIATE
The classic book on statistical graphics, charts, tables. Theory and practice in the design of data graphics, 250 illustrations of the best (and a few of the worst) statistical graphics, with detailed analysis of how to display data for precise, effective, quick analysis.
Best for: Understanding the principles and theory behind effective data graphics.
Read sample on Open Library · Buy on Amazon
2. Storytelling with Data — Cole Nussbaumer Knaflic

⭐ 4.3/5 (38 ratings) · 252 pages · 2015
BEGINNER
Don’t simply show your data—tell a story with it! Teaches you the fundamentals of data visualization and how to communicate effectively with data. The lessons are grounded in theory, but made accessible through numerous real-world examples—ready for immediate application.
Best for: Business professionals who create presentations and reports with data.
Read sample on Open Library · Buy on Amazon
3. The Functional Art — Alberto Cairo

⭐ 4.5/5 (8 ratings) · 384 pages · 2011
INTERMEDIATE
Alberto Cairo bridges the gap between data visualization and information design. Drawing from his experience in journalism and academia, Cairo explains how to create graphics that are both beautiful and functional, packed with real-world examples from news organizations worldwide.
Best for: Journalists, designers, and anyone creating infographics for general audiences.
Read sample on Open Library · Buy on Amazon
4. Information Dashboard Design — Stephen Few

⭐ 4.2/5 (15 ratings) · 224 pages · 2006
INTERMEDIATE
The definitive guide to designing dashboards that actually work. Stephen Few methodically breaks down what makes dashboards effective (and what makes them fail). Essential for anyone building dashboards in Tableau, Power BI, or similar tools.
Best for: BI professionals, analysts, and anyone building dashboards.
Read sample on Open Library · Buy on Amazon
5. Dear Data — Giorgia Lupi & Stefanie Posavec

⭐ 4.1/5 (9 ratings) · 289 pages · 2016
BEGINNER
A beautiful, unconventional take on data visualization. Two information designers spent a year sending each other hand-drawn postcards visualizing the details of their daily lives. An inspiring reminder that data visualization doesn’t require software—just curiosity and creativity.
Best for: Anyone seeking creative inspiration or a more personal approach to data.
Read sample on Open Library · Buy on Amazon
6. Visualize This — Nathan Yau

⭐ 3.9/5 (9 ratings) · 384 pages · 2011
INTERMEDIATE
A hands-on, practical guide to creating visualizations using real tools. Nathan Yau (of FlowingData fame) walks you through actual projects using R, Python, and design software. Move beyond Excel to create custom, publication-quality graphics.
Best for: Programmers and analysts who want to build custom visualizations with code.
Read sample on Open Library · Buy on Amazon
7. The Truthful Art — Alberto Cairo

⭐ 4.2/5 (5 ratings) · 400 pages · 2016
INTERMEDIATE
Cairo’s follow-up to The Functional Art goes deeper into the ethics and practice of honest visualization. In an era of misleading charts and “fake news,” learn how to create graphics that inform rather than manipulate—while still being visually compelling.
Best for: Those interested in the ethics of data communication and avoiding visualization pitfalls.
Read sample on Open Library · Buy on Amazon
8. Data Points — Nathan Yau

⭐ 3.5/5 (2 ratings) · 320 pages · 2013
INTERMEDIATE
Yau’s second book focuses less on tools and more on the thinking behind great visualizations. Explores how to find stories in data and design visualizations that resonate with audiences. Full-color examples make concepts concrete and memorable.
Best for: Intermediate practitioners ready to elevate their visualization thinking.
Read sample on Open Library · Buy on Amazon
9. Show Me the Numbers — Stephen Few

⭐ 3.4/5 (5 ratings) · 400 pages · 2004
BEGINNER
A comprehensive guide to designing tables and graphs for business communication. Few covers the fundamentals of visual perception and applies them systematically to common business chart types. More textbook than page-turner, but the depth is unmatched.
Best for: Those who want a thorough understanding of chart design principles.
10. Knowledge is Beautiful — David McCandless

⭐ 4.0/5 (2 ratings) · 255 pages · 2014
BEGINNER
A visual feast from the creator of Information is Beautiful. McCandless transforms complex datasets into stunning, full-page infographics covering everything from science to pop culture. Proof that data visualization can be art.
Best for: Visual inspiration and seeing what’s possible at the intersection of data and design.
Last updated: February 2025. Ratings from Hardcover. As an Amazon Associate, I earn from qualifying purchases.