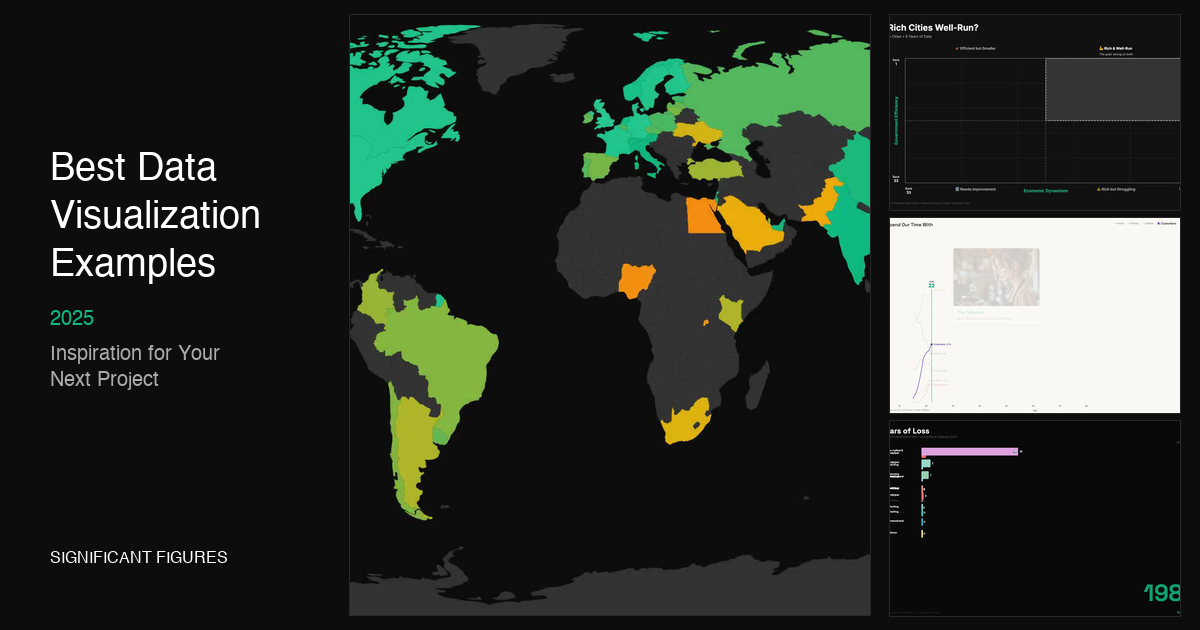
Best Data Visualization Examples in 2025 (Inspiration for Your Next Project)
Great data visualization doesn’t just present numbers—it tells a story, reveals patterns invisible to the naked eye, and helps us make sense of an increasingly complex world. Whether you’re a designer, analyst, journalist, or just someone who appreciates beautiful information design, studying the best examples is one of the fastest ways to level up your own work.
We’ve curated 15 of the most impressive data visualization examples from 2024-2025, organized by category. For each example, we break down what makes it effective and the techniques that bring it to life. Bookmark this page—you’ll want to return to it whenever you need inspiration.
What Makes a Great Data Visualization?
Before diving in, let’s establish what separates the good from the great:
- Clarity over decoration — The data should be the star, not the design flourishes
- Appropriate form — The visualization type matches what the data is trying to say
- Progressive disclosure — Reveals complexity gradually rather than overwhelming upfront
- Accessibility — Works for colorblind viewers, includes alt text, and degrades gracefully
- Emotional resonance — Connects the abstract numbers to human experiences
Interactive & Animated Data Visualizations
Interactive visualizations let viewers explore data on their own terms—drilling down into what interests them most. Here are standout examples:
1. Climate TRACE — Global Emissions Tracker
What it does: Tracks greenhouse gas emissions from over 744 million individual sources worldwide, updated in near real-time using satellite imagery and AI.
Why it works: Climate TRACE takes an overwhelming global problem and makes it tangible. You can zoom into any country, any sector, any year—and see exactly where emissions are coming from. The interface balances simplicity (clear totals, obvious drill-downs) with depth (10+ years of data, 67 sub-sectors).
Tools/techniques: Satellite data, machine learning models, Mapbox-style interactive mapping
🔗 View it: climatetrace.org/explore
2. Our World in Data — Life Expectancy Charts
What it does: Lets you explore 200+ years of life expectancy data across every country, with toggles between map view, line charts, and tables.
Why it works: OWID has perfected the “simple question, deep exploration” pattern. Start with a clear headline chart, then let curious viewers dig into methodology, download data, or embed charts in their own work. The attention to sourcing and transparency sets the standard for research visualization.
Tools/techniques: Custom React-based charting library, SVG rendering, comprehensive API
🔗 View it: ourworldindata.org/grapher/life-expectancy
3. Gapminder — The Original Bubble Chart
What it does: The tool that made Hans Rosling famous—an animated bubble chart showing the relationship between income, life expectancy, and population over time.
Why it works: Animation brings statistics to life. Watching 200 years of progress play out in 30 seconds creates emotional impact that static charts simply can’t achieve. The interface is dead simple: press play and watch the story unfold.
Tools/techniques: D3.js, SVG animation, connected scatterplot design pattern
🔗 View it: gapminder.org/tools
4. Bluesky Network Map
What it does: Visualizes the social network of 3.4 million Bluesky users, positioned by follow patterns so that communities cluster together naturally.
Why it works: Network visualizations are notoriously hard to make useful—most end up as undifferentiated hairballs. This one succeeds by using force-directed layout to create meaningful spatial relationships. You can actually find your niche (data viz folks? They’re clustered near R users and cartographers).
Tools/techniques: Force-directed graph layout, WebGL rendering for performance at scale
🔗 View it: bluesky-map.theo.io
Scrollytelling & Narrative Visualization
Scrollytelling combines the power of data visualization with narrative journalism. These pieces guide you through a story, revealing data at exactly the right moment.
5. The Pudding — “Are Pop Lyrics Getting More Repetitive?”
What it does: Analyzes 15,000 Billboard Hot 100 songs using compression algorithms to measure lyrical repetitiveness—then visualizes how this has changed from 1958 to 2017.
Why it works: The Pudding is the gold standard for data-driven essays, and this piece exemplifies their approach. It starts with a relatable question, teaches you the methodology interactively (you can compress your own text!), then reveals surprising findings. The pacing is immaculate—each scroll reveals exactly one new insight.
Tools/techniques: Scrollama.js, D3.js, Lempel-Ziv compression algorithm
🔗 View it: pudding.cool/2017/05/song-repetition
6. The Pudding — “Women’s Pockets Are Inferior”
What it does: Measures the pockets in 80 pairs of jeans across 20 brands, proving with data what every woman already knows—women’s pockets are absurdly small.
Why it works: It takes an everyday frustration and quantifies it. The scroll-driven animations show each pocket measurement building up into a damning comparison. The interactive “what can fit” section lets you test whether an iPhone, wallet, or even your hand would fit in various pockets. It’s rigorous research presented playfully.
Tools/techniques: Scroll-driven animation, comparative bar charts, physical measurement data
🔗 View it: pudding.cool/2018/08/pockets
7. The Pudding — “The Naked Truth” (Foundation Shade Names)
What it does: Analyzes the names of 6,816 complexion products to reveal how the beauty industry’s naming conventions systematically favor lighter skin tones (“nude,” “natural,” “porcelain”) while using less flattering descriptors for darker shades.
Why it works: This piece transforms an invisible bias into visible evidence. The scroll-driven reveals are perfectly timed—you see the pattern emerging before the text confirms it. It’s investigative journalism through data design.
Tools/techniques: Text analysis, color-coded spectrum visualization, scrollytelling
🔗 View it: pudding.cool/2021/03/foundation-names
8. NYT Graphics — “Inside the Deportation Machine”
What it does: Analyzes data on every ICE arrest, detention stay, and deportation to reveal the complexity and reach of immigration enforcement infrastructure.
Why it works: The NYT Graphics team excels at making complex systems comprehensible. This piece breaks down an opaque bureaucracy into understandable flows—where people are arrested, where they’re detained, where they’re sent. The data journalism is impeccable; the visual storytelling makes it accessible.
Tools/techniques: Sankey diagrams, geographic mapping, government data FOIA
🔗 View it: nytimes.com/interactive (deportation network)
Real-Time Dashboards
Real-time visualizations face unique challenges: they need to update constantly while remaining readable and not overwhelming users with change.
9. ProPublica — 527 Explorer (Political Money Tracker)
What it does: Tracks hundreds of millions of dollars flowing through unregulated political organizations (527s), making the data searchable and explorable.
Why it works: ProPublica’s data apps excel at turning complex datasets into public accountability tools. The 527 Explorer lets anyone search contributors, organizations, and expenditures—turning opaque campaign finance into transparent records. The design is utilitarian by necessity: the data is the feature.
Tools/techniques: Full-text search, filterable database interface, FEC data integration
🔗 View it: projects.propublica.org/527-explorer
10. FlowingData — Fields of Study Rankings
What it does: Ranks fields of study by bachelor’s degrees conferred since 1970, showing how professional priorities have shifted over 50+ years.
Why it works: Nathan Yau’s FlowingData consistently produces clean, insight-dense visualizations. This ranking chart uses the bump chart format perfectly—you can trace any field’s trajectory, spot the rise of Computer Science, and see which fields have remained stable. No unnecessary decoration, just data doing the talking.
Tools/techniques: Bump chart/slope graph, R + ggplot2, NCES data
🔗 View it: flowingdata.com (fields of study)
Static & Print Visualizations
Not everything needs to be interactive. Some of the most powerful data visualizations are static—designed for print, posters, or single-image sharing.
11. Information is Beautiful — “Joy Division Climate Chart”
What it does: Visualizes 2023 temperature records using the iconic “ridgeline” style from Joy Division’s Unknown Pleasures album cover—each line represents a year, stacked to show warming trends.
Why it works: This is data visualization as art. The familiar visual metaphor (anyone who’s seen the album cover recognizes it instantly) creates immediate emotional resonance. The climate data becomes visceral—you can see the recent years pushing upward, breaking free of historical norms.
Tools/techniques: Ridgeline plot, temporal stacking, artistic data design
🔗 View it: Information is Beautiful Awards
12. “66 Ways to Murder” — Agatha Christie Infographic
What it does: Charts the combinations of motives, weapons, and methods across Agatha Christie’s murder mysteries.
Why it works: Sometimes the best data viz comes from unexpected datasets. This piece takes literary analysis and turns it into a playful reference chart—equally useful for Christie fans and aspiring mystery writers. The design leans into the genre’s aesthetic: elegant, slightly macabre, and clever.
Tools/techniques: Matrix visualization, categorical encoding, print-ready design
🔗 View it: Information is Beautiful Awards
13. Reuters — “Buildings Wrapped in Solid Gasoline” (Grenfell Investigation)
What it does: Investigates the persistent use of flammable cladding materials in high-rise buildings worldwide, following the Grenfell Tower tragedy.
Why it works: Reuters Graphics consistently produces some of the best investigative data journalism. This piece combines 3D building diagrams, fire spread animations, and global mapping to show that the problem isn’t isolated—it’s systemic. The technical execution serves the journalism.
Tools/techniques: 3D modeling, fire simulation, global database mapping
🔗 View it: Information is Beautiful Awards
14. “Atlas of AI Risks”
What it does: Maps the landscape of AI risks—from facial recognition errors to algorithmic hiring bias to deepfakes—showing how AI systems are quietly shaping everyday decisions.
Why it works: As AI becomes ubiquitous, visualizing its impacts becomes crucial. This atlas takes an abstract concern and makes it concrete: here are the specific ways AI could affect your job search, your video recommendations, your interactions with law enforcement. The comprehensive mapping approach helps viewers see connections between seemingly unrelated risks.
Tools/techniques: Network/map hybrid, categorical risk taxonomy, interactive exploration
🔗 View it: Information is Beautiful Awards
15. “Michelin Tasting Menu” — Scrollytelling + Print Hybrid
What it does: Explains the rigorous standards behind Michelin Stars through an 8-page printed broadsheet combined with interactive scrollytelling.
Why it works: This project bridges print and digital beautifully. The broadsheet works as a standalone artifact; the interactive version adds depth and exploration. It’s a masterclass in designing the same content for different mediums.
Tools/techniques: Print design, scrollytelling, dual-format publishing
🔗 View it: Information is Beautiful Awards
Common Patterns in Great Data Visualization
After reviewing dozens of award-winning examples, a few patterns emerge:
- Start with a question, not a dataset. The best examples begin with human curiosity: “Are songs getting more repetitive?” “Where do emissions actually come from?” “Why are women’s pockets so small?”
- Respect the reader’s time. Progressive disclosure lets casual viewers get the headline while rewarding deeper exploration.
- Choose the right level of interactivity. Not everything needs to be clickable. Sometimes a well-designed static chart communicates more clearly than an over-engineered dashboard.
- Animation should reveal, not decorate. Movement works when it shows change over time or guides attention. Gratuitous animation just distracts.
- Source everything. The best data journalism is transparent about where the data came from, how it was processed, and what limitations exist.
Tools & Resources for Creating Your Own
Ready to create your own data visualizations? Here are the tools behind many of the examples above:
- D3.js — The foundational library for web-based custom visualization
- Observable — Notebook-style environment perfect for prototyping and sharing
- Scrollama — Lightweight scrollytelling library
- Mapbox / Leaflet — Interactive mapping
- R + ggplot2 — Statistical visualization with publication-quality output
- Flourish / Datawrapper — No-code tools for quick, professional charts
For animated data visualizations specifically, tools like Remotion and Significant Figures (that’s us!) are making it easier to create broadcast-quality animated data stories without deep video production expertise. We’re particularly excited about bringing the kind of animation you see in Gapminder to anyone with a story to tell.
Keep Exploring
Data visualization is a craft that rewards continuous learning. Bookmark these resources for ongoing inspiration:
- The Pudding — Visual essays with impeccable design
- FlowingData — Nathan Yau’s daily curation and tutorials
- Our World in Data — Open-source research and visualization
- Information is Beautiful Awards — Annual showcase of the best work
- NYT Graphics — The newsroom standard for visual journalism
The best data visualization examples share one thing: they make you see something you couldn’t see before. Whether that’s the acceleration of global emissions, the absurdity of pocket inequality, or the hidden patterns in pop music—great data viz reveals truths that numbers alone can’t convey.
What’s your favorite data visualization? Tag us @sigfigsstudio with examples we should add to this list.